
Employee disengagement is often discussed as a culture problem. For the C-suite, it belongs on the financial agenda. In Australia, disengaged employees cost the economy approximately AU$223 billion annually. That scale reframes the issue. Low engagement isn't a marginal workplace concern. It's a material drag on output, attendance, retention and operating performance.
Inside a single organisation, the same pattern plays out in a less visible way. Missed initiative, avoidable absence, slower execution and preventable turnover rarely sit together in one line item, so leaders underestimate the total impact. The result is predictable. Budget holders scrutinise engagement programs as discretionary spend while absorbing the far larger cost of doing nothing.
For leadership teams planning for the next operating cycle, the sharper question isn't whether disengagement exists. It's how much it is already costing the business, where it is leaking value, and which interventions can be measured against that loss. The broader workplace context in The State of Work in 2026 makes that leadership challenge even clearer.
Table of Contents
The Real Price of Workplace Apathy
A disengaged employee isn't merely dissatisfied. In a corporate setting, disengagement means reduced discretionary effort, weaker alignment with team goals, lower care for quality, and less willingness to solve problems beyond the minimum standard. Finance sees the result in margin pressure. Operations sees it in delays and rework. People leaders see it in exit risk and manager strain.
The cost of disengaged employees is rarely confined to one function. A business can hit revenue targets for a quarter and still be eroding value through poor execution quality, unstable teams and avoidable replacement costs. When leaders treat disengagement as a sentiment issue rather than a performance issue, they miss the cumulative effect.
Practical rule: If a workforce problem affects productivity, absence, turnover and service quality at the same time, it belongs in commercial planning, not only in HR reporting.
For executive teams, apathy is expensive because it weakens systems that are meant to compound performance. Strong strategy still depends on engaged managers to communicate priorities. Customer promises still depend on frontline teams to deliver consistently. Innovation still depends on people contributing energy, ideas and judgement. When those conditions weaken, the organisation doesn't just lose output. It loses pace.
A sharper way to define disengagement is this: it is the gap between salary paid and value realised. Some of that gap is visible, such as unplanned leave or resignations. Some of it is buried in slower handovers, lower initiative, weak collaboration and muted customer care. Senior leaders don't need another reminder that engagement is “important”. They need a method for quantifying where value is being lost and what response has the strongest operational case.
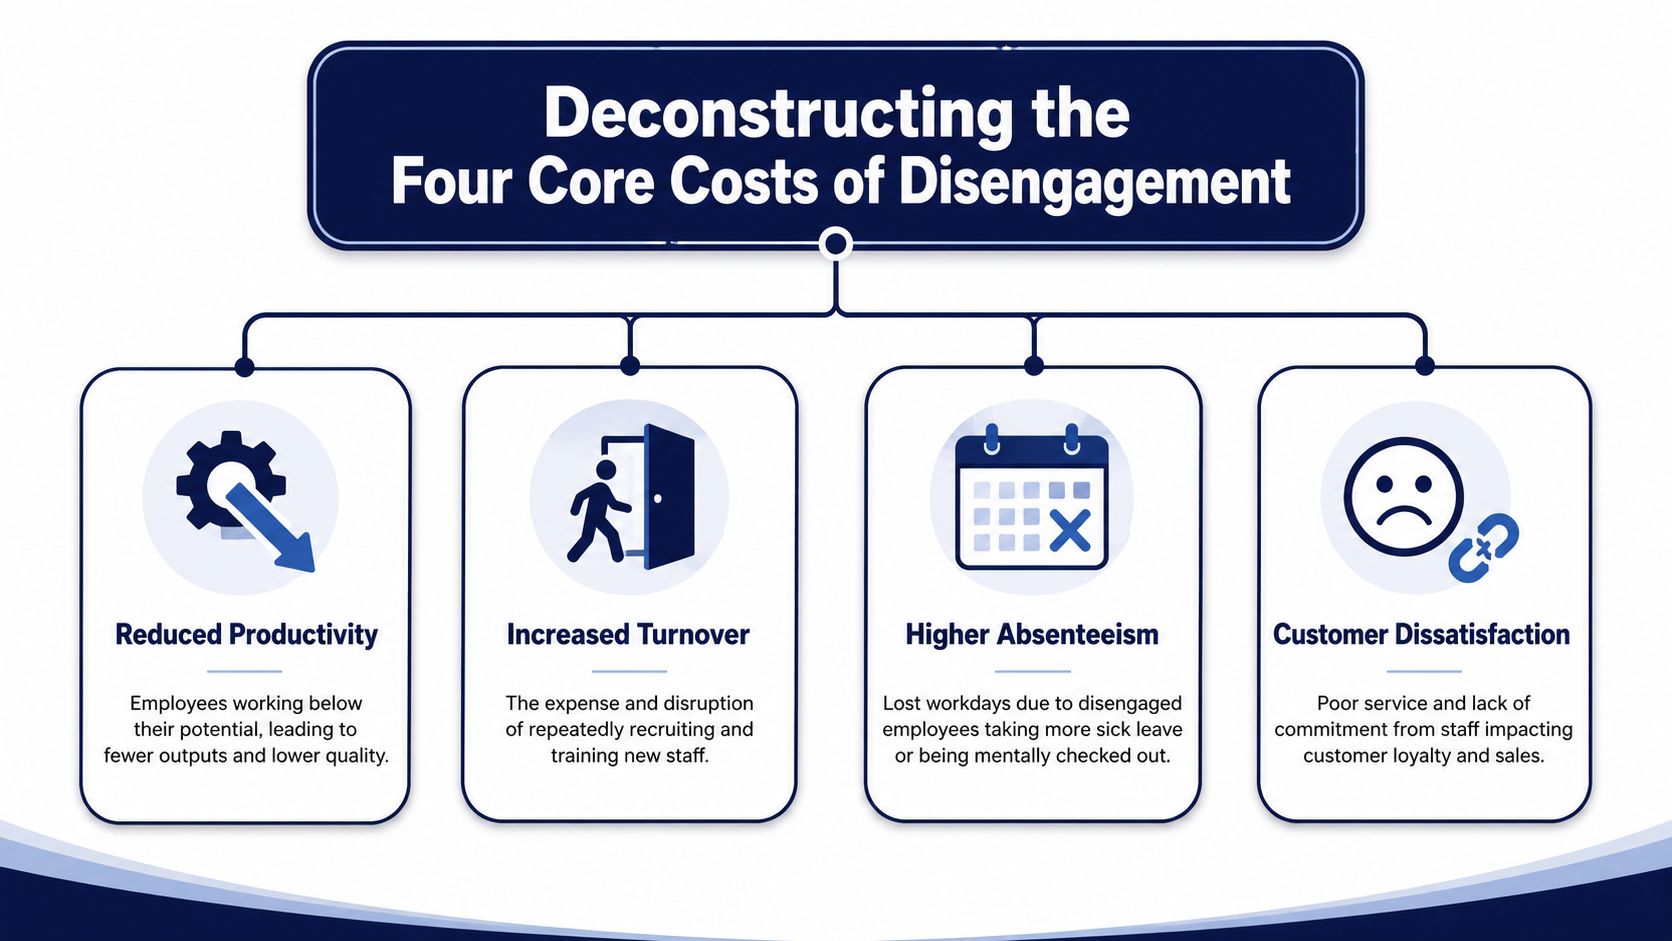
Deconstructing the Four Core Costs of Disengagement
The most useful way to assess disengagement is to break it into cost centres that a leadership team already understands. That turns a broad culture concern into a set of commercial risks with owners, measures and intervention options.
Australian employers already have a clear baseline. On an individual level, disengagement costs companies an average of $17,000 per year per employee, or roughly 34% of annual salary, driven by performance losses, higher absenteeism and increased turnover as outlined by Athena Consulting. For leaders looking to sharpen the underlying drivers, this overview of understanding employee engagement provides useful context.
Lost productivity shows up before leaders label it disengagement
Productivity loss is usually the first cost, even if it's the last one named. Teams still appear busy. Meetings still happen. Projects still move. But output quality softens, discretionary effort fades and fewer people carry work forward without prompting.
This form of loss tends to be undercounted because payroll remains constant while contribution drops. Leaders often treat it as a management capability issue or a workload issue. Sometimes it is. But where disengagement is present, salary spend keeps flowing while realised value falls short of what the role should produce.
Absenteeism is an early operational warning sign
Attendance data often reveals disengagement earlier than engagement surveys do. A disengaged employee is more likely to withdraw through unplanned leave, increased sick days or inconsistent availability. That pushes workload onto peers, disrupts continuity and forces managers into reactive resourcing.
The direct cost is wages paid for non-productive time. The indirect cost is broader: broken workflow, delayed decisions, overtime pressure and loss of context on active work.
Absence doesn't only remove capacity. It also transfers friction to everyone else who has to absorb the gap.
Turnover converts a culture issue into a balance-sheet issue
When disengaged employees leave, the cost isn't limited to recruitment. The organisation also loses role-specific knowledge, team trust and time invested in onboarding and development. In practice, voluntary exits create a sequence of costs rather than a single event.
Turnover also distorts leadership attention. Instead of focusing on growth, capability and delivery, managers spend time rehiring, redistributing work and restoring team confidence.
Presenteeism, errors and customer impact are the hidden layer
The least discussed costs are often the ones that shape reputation. Presenteeism occurs when people are physically present but mentally detached. The employee is “at work”, yet concentration, ownership and care for detail are reduced. That can lead to more mistakes, weaker collaboration and slower customer response.
A customer rarely experiences disengagement as an internal culture issue. The customer experiences it as indifference, inconsistency or poor follow-through. That's why disengagement can move from an internal employee metric to an external commercial problem without much warning.
A concise executive view of the four costs looks like this:
Productivity leakage: Salary spend remains fixed while output, initiative and quality decline.
Attendance pressure: Unplanned absence disrupts continuity and forces teams into reactive work allocation.
Turnover burden: Exit costs include replacement, ramp-up time and loss of internal knowledge.
Service and quality drag: Presenteeism and errors weaken customer experience and operational reliability.
A Practical Formula for Calculating Your Disengagement Cost
Leaders don't need a complex model to quantify the cost of disengaged employees. They need a disciplined estimate built from workforce data they already hold. The aim isn't forensic precision. It's to build a credible commercial range that can support action.
The following approach works best when HR, Finance and business unit leaders calculate the cost together. That avoids the common mistake of treating disengagement as a People & Culture metric rather than an operating cost.
Start with the inputs leadership already has
A practical model uses a small set of internal data points:
Headcount
Average salary
Estimated number of disengaged employees
Absence patterns
Turnover levels
Business unit profitability or margin trend
At this stage, leaders don't need perfect segmentation. A sound first pass is enough to reveal whether the annual loss is minor, moderate or strategically significant.
Four formulas that turn disengagement into a finance discussion
The strongest models isolate cost by category. Each category can then be stress-tested by Finance.
| Cost Category | Formula | Example Calculation | Annual Cost |
|---|
| Productivity loss | Number of disengaged employees × average annual salary × 34% | 30 × $50,000 × 34% | $510,000 |
| Absenteeism impact | Additional unplanned absence days × average daily employment cost | Internal payroll and absence records required | Organisation-specific |
| Turnover premium | Additional disengagement-linked exits × replacement cost per exit | Based on internal turnover and salary data | Organisation-specific |
| Profitability drag | Performance gap between more-engaged and less-engaged teams × relevant revenue or margin | Internal performance and margin comparison required | Organisation-specific |
The turnover line deserves special attention. Organisations with high disengagement experience up to 43% more turnover, and business units with disengaged workers are 15% less profitable than engaged counterparts based on analysis from HR University. That's the bridge between workforce sentiment and operating performance. For leaders focused on reducing preventable exits, these employee retention strategies are relevant because retention and engagement usually move together.
Board-level lens: When a workforce issue shows up in profitability and turnover, it has crossed from culture reporting into enterprise risk.
Worked example for a 100-employee company
Consider a hypothetical Australian business with 100 employees. Its engagement data, manager observations and workforce trends indicate that 30 employees are disengaged.
Assume the average annual salary is $50,000 and the organisation applies a productivity-loss estimate of 34% of salary for each disengaged employee.
The calculation is:
30 disengaged employees × $50,000 average salary × 34% = $510,000 in estimated annual productivity loss
This figure reframes disengagement from an internal culture concern into a measurable and potentially recoverable cost.
The next step is to examine turnover. Where less-engaged teams are also experiencing repeated exits, the additional recruitment, onboarding and lost-capacity costs should be calculated separately. Finance should use the organisation’s approved replacement-cost assumptions rather than relying on broad market estimates.
Leaders can then compare profitability, service quality, absence and employee turnover across teams with different engagement results. Where the patterns consistently align, there is a stronger case that disengagement is contributing to the performance gap.
A practical executive checklist for the model is:
Start with productivity loss: Multiply the number of disengaged employees by the average annual salary and then by 34%.
Identify hot spots: Compare functions, locations and managers rather than treating the workforce as one group.
Separate the cost categories: Avoid counting absence, turnover and productivity losses twice.
Use internal data: Apply payroll, absence, turnover and margin figures already accepted by Finance.
Model realistic recovery: Estimate the portion of the loss that targeted action could reasonably recover.
This changes the quality of the conversation. Instead of asking whether employee engagement deserves investment, leadership teams can consider which interventions are most likely to reduce a known and recurring business cost.
Australian Benchmarks What Your Numbers Really Mean
An internal estimate only becomes persuasive when executives can place it against the national picture. Without context, even a six-figure disengagement cost can look like noise in a large operating budget. Benchmarks solve that problem by showing whether a business is facing an isolated issue or reflecting a broader Australian pattern.
The national picture gives local numbers context
Australia's engagement baseline is confronting. Only 23% of Australian workers are engaged at work, which means 77% are either disengaged or actively disengaged, contributing to a productivity loss of approximately AU$223 billion annually reported by IBT Australia. For leaders reviewing internal scores, that benchmark changes the interpretation. A business doesn't need to be in crisis to have a costly disengagement problem. It may be operating in line with an unhealthy national norm.
The more useful executive question is whether the organisation is better or worse than that benchmark in critical teams. A moderate company-wide score can hide a severe issue in one function, one site or one leadership cohort. That's why aggregate data often understates the commercial risk.
For broader context on what stronger engagement looks like in practice, this guide to engagement and the employee experience is a useful companion.
How executives should interpret the benchmark gap
A benchmark isn't a verdict. It's a decision tool. If a company's internal estimate already points to a meaningful loss, national data does two things. It validates that the issue is real, and it reduces the temptation to dismiss the problem as anecdotal.
Leaders can use the benchmark in three ways:
To quantify urgency: If internal disengagement aligns with the national pattern, inaction is likely preserving a known cost rather than avoiding one.
To prioritise intervention: The benchmark helps direct attention to the teams where disengagement appears commercially concentrated.
To strengthen the business case: External evidence makes it easier for HR and People & Culture leaders to secure support from finance-minded stakeholders.
A benchmark doesn't tell a leadership team what to do. It tells them whether waiting is a rational choice. In most cases, it isn't.
From Cost Centre to Profit Driver The ROI of Re-engagement
A credible engagement strategy has to compete with every other claim on budget. That means the case for action can't rest on morale language alone. It has to show how a better employee experience may reduce avoidable costs and improve execution quality.

Why play-based intervention belongs in a commercial conversation
Play-based team building is often mistaken for a morale event, but its commercial value lies in what play activates. Well-designed play creates participation, curiosity, shared problem-solving, social connection and immediate feedback. These are not side benefits. They are the behaviours that disengaged teams often stop demonstrating.
The neuroscience strengthens that case. Play engages brain systems associated with motivation, reward, learning, adaptability and social connection. It creates novelty, which captures attention, while shared challenge encourages people to read one another, communicate, experiment and adjust in real time. In environments where work has become flat, fragmented or purely transactional, play can help reactivate the cognitive and social processes that support engagement.
This is why play belongs in a broader commercial discussion about disengagement. ELMO Software’s analysis of the cost of employee disengagement shows how disengagement can translate into lost productivity, reduced performance and higher workforce costs. Play-based intervention addresses the human behaviours beneath those outcomes by creating an environment where people actively contribute rather than passively attend.
The point is not that one event will permanently rewire a team or solve every source of disengagement. It is that play provides a powerful behavioural reset and rehearsal space. Teams practise communication, trust, flexible thinking and collective problem-solving under conditions that feel safe enough for participation but structured enough to reveal how they work together.
Support systems remain important, particularly when stress, mental health or cognitive strain require individual assistance. This guide to Employee Assistance Program benefits provides useful context for the role formal support can play alongside broader engagement strategies. Play and employee support serve different purposes: one helps people access appropriate individual assistance, while the other actively rebuilds connection, energy and collaborative behaviour across the team.
For executives, the commercial question is therefore not whether play is serious enough for the workplace. It is whether the organisation can afford to ignore an intervention that directly activates many of the behaviours disengagement suppresses.
How to model ROI without overstating certainty
The strongest ROI model starts with the current disengagement cost estimate and asks a restrained question: if a targeted intervention improves connection, communication and morale in a measurable pilot group, what cost recovery might follow?
A sensible approach includes:
A defined pilot population: one division, leadership cohort or conference team rather than the whole organisation
A clear objective: for example, improving team cohesion, cross-functional trust or manager-team connection
A short measurement window: enough to compare pre- and post-intervention signals such as pulse feedback, absence trends, manager observation and retention risk
A conservative recovery assumption: leadership should model a modest reduction in known cost, not promise wholesale transformation
Many engagement initiatives fail at the commercial stage, not the cultural stage. They may improve sentiment, but they aren't set up to demonstrate whether they altered cost drivers. A targeted play-based program can be assessed more rigorously if the organisation defines the business problem first, identifies the team most affected, and measures whether relational and behavioural changes follow.
The useful question isn't whether a team-building intervention “works” in the abstract. It's whether a targeted intervention changes the specific conditions that are driving cost in a defined team.
Your Action Plan for Reducing Disengagement Costs
Most organisations don't need another engagement slogan. They need a sequence of decisions that turns a hidden cost into a manageable one. That starts with measurement, then diagnosis, then intervention.
A practical roadmap looks like this:
- Calculate the current cost
Use the formulas above and build a credible annual estimate. Even a first-pass model can reveal whether disengagement is consuming more value than leaders assumed.
- Diagnose the drivers
Don't treat disengagement as one problem. Use survey feedback, manager interviews, absence trends and turnover data to identify whether the underlying cause is leadership, role clarity, workload, team friction or weak connection.
- Pilot a targeted intervention
Choose one team or cohort where the cost is visible and the leadership sponsor is engaged. Set an objective, define what success looks like, and measure the change. Organisations reviewing broader retention approaches may also find this resource on staff retention strategies useful when linking engagement efforts to retention planning.
The final step is to avoid defaulting to generic activity. Interventions should match the problem. If a team is suffering from low trust, fragmented communication or conference fatigue, a structured and measurable team experience will outperform a loosely designed social event. For leaders exploring practical options, these employee engagement activities offer a useful starting point for thinking about format, objectives and fit.
Apathy at work rarely appears in one dramatic signal. It shows up as leakage. Strong leaders measure leakage, trace the pattern, and act before it becomes structural.
For organisations ready to quantify the cost of disengaged employees and respond with a more strategic culture intervention, Corporate Challenge Events offers play-based team building designed for workplaces, conferences and offsites across Australia and New Zealand. Their programs help leadership teams move beyond generic morale initiatives toward experiences that strengthen connection, communication and team performance.